
Sunday 14 July 2013
And Another ...
Dow Chemicals - acting as strong as the Index, with what looks like a test in a rising market, although the programme is calling it no supply. Either signal is a sign of strength.

Thursday 11 July 2013
Another one
Another stock acting stronger than the Index, and with a test in a rising market - ideal place to go long.


Wednesday 10 July 2013
Stocks
In my last post I said I would be taking a look at stocks, and indeed I have been doing some study, trawling through all the stocks in the US market, and picking out those stocks that are acting as strong or stronger than the Index. I saw an opportunity in Citigroup (C), and, as you will see in the chart below, it has responded to the strength in the background and is indeed going up. I'm kicking myself for not going long back when I saw the opportunity, and am now looking for a test in a rising market to enter a trade. My guess (and it's a guess because you never know what the market will do because a contradictory sign could come in any moment) is that it will continue up to that top trendline. It has been in an upward trend for some time, zigzagging through the trend channel. I also have a long list of stocks in my watchlist that are acting as strong/stronger than the Index, and am waiting a VSA principle to get in, namely a test in a rising market.


Tuesday 2 July 2013
20 Points Profit
There are two charts below - a 15 minute and a 20 minute. The market rose from the open and stalled somewhat at the 14980 level. At point A (in the 15 minute chart) we see an upthrust, and to confirm this, in the 20 minute chart, at Point A we see no demand. The market fell steadily on this lack of demand and I took my 20 points profit.
I may not be trading for a little while due to the market being closed for a couple of days, and some work commitments before I go away on 15th July, but will keep looking when I can.
Also I am starting to look at Stocks to trade on a daily basis. My first analysis was correct - Citigroup. I didn't trade it though as I'm experimenting at the moment. See chart below. Citigroup appears to be looking as strong as the Index, and at Point A we see a test, immediately after a sign of weakness. I would have put my stop below the last reaction low and my limit at 100 points. You will notice that after the test we have what looks like a shakeout, which is a bullish sign in itself. I will continue to watch this to see how it unfolds.


Wednesday 19 June 2013
Lost Today
Today I lost 11 points. The chart below is a 10 minute chart of the Dow Jones. At Point A we see what looks like a test - down-bar, low volume, closing near the high. The test failed, as you will see by the down-bar following, and as I saw weakness in the lower timeframes I got out at a loss. In hindsight you can see that at Point A we've reached an area of possible resistance - a previous level. This is probably why the test failed. Plus, following the failed test the market has literally gone sideways - a warning that this is not a good day to trade, not so far anyway.


Friday 14 June 2013
12 Points Profit
I was short for time today, which usually means I don't trade, but I took a quick trade and made 12 points profit. There was News at 2.55pm and the market rose rapidly. I watched this happening until eventually some weakness appeared in several of the timeframes. The chart below is the 10 minute, but weakness also appeared on the 15 and 20 minute charts. The signal on this chart, at Point A, says supply coming in. The reason for this is because we have had an up-move and eventually, at Point A, the volume has increased and it has closed off the high. However, this is not enough evidence for us to go short (sell). We need to see confirmation that there is weakness. Of course, yes, as is the case, the market falls quite a bit, and I am watching it, but I do not get in. I wait for confirmation which I see on the 5 minute chart. See the chart below this one.
On the 5 minute chart at Point A we have no demand (no interest in higher prices). This alone is not enough for us to enter the market, but coupled with the weakness that has also appeared at this point on the larger timeframes, it alerts us to a possible trade. The market then falls (confirming the no demand), then at Point B we have another no demand - confirmation. This is my point to go short. I took my profit thank you very much.
I have had a very good week again and my aim next is to stay in my trades longer and really rocket the profits. However, caution is required. I have found what works, I'm building my account steadily, so there's a little voice in my head telling me "if you've found something that works, why change it?" So I'm considering carrying on as I am and investing more in each trade for higher gains. Will meditate on it!


Wednesday 12 June 2013
Upthrust + Why To Be Cautious of Market Open
I took 20 points today, short, on the 5 minute chart of the Dow Jones. See the chart below. At Point A is our upthrust. Not only is it an upthrust, it has very high volume (selling), and we have the added bonus of it penetrating an area of resistance, but closing on the low, below that level.

Also see the 1 hour chart below. This is a good illustration of why we must be very cautious at the market open, and why I would not want to be in a trade before the market open. The bar at Point X, you would think, is a test. The programme has put up a signal saying this. However, beware the volume is not less than the previous two bars, so this means there is some supply in here. But to the eye, the bar looks like a test. You may think this will influence the market, but the next bar, which is at market open, is a trap upmove (serious sign of weakness), and the market has fallen since. So beware trading at the market open. Because of the volatility it can be very profitable, but it is also very dangerous. There are traders who do trade at the open, and make good money, so I'm sure it's possible. But my aim is to avoid too much stress! If trading becomes very stressful we build a negative association, which is detrimental to our success.
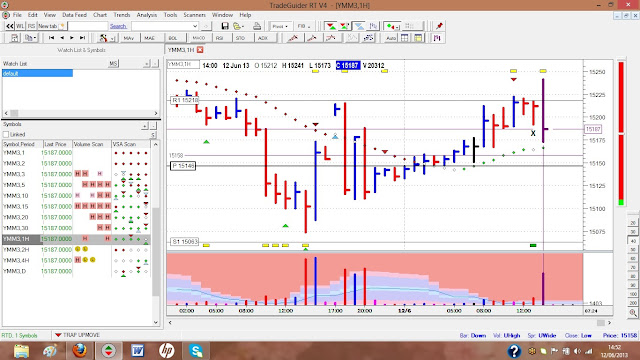

Also see the 1 hour chart below. This is a good illustration of why we must be very cautious at the market open, and why I would not want to be in a trade before the market open. The bar at Point X, you would think, is a test. The programme has put up a signal saying this. However, beware the volume is not less than the previous two bars, so this means there is some supply in here. But to the eye, the bar looks like a test. You may think this will influence the market, but the next bar, which is at market open, is a trap upmove (serious sign of weakness), and the market has fallen since. So beware trading at the market open. Because of the volatility it can be very profitable, but it is also very dangerous. There are traders who do trade at the open, and make good money, so I'm sure it's possible. But my aim is to avoid too much stress! If trading becomes very stressful we build a negative association, which is detrimental to our success.

Thursday 6 June 2013
Great Opportunity
I wasn't going to trade today. I was out all day in the sunshine selling wool-filled British duvets with a friend at a big agricultural show! But when I got home I put my laptop on and saw a lovely test in the 20 minute chart. I was very cautious about going long (buying) because the market has recently been extremely weak and there was nothing in the daily chart to say that it would be any different today.
However, the chart below shows a lovely principle that is very powerful. First of all we see that during the day (when I was at the show) the market fell. But at Point A we see some very high volume - stopping volume - possible buying. This is followed by Point B where we have a down-bar but on low volume (volume less than the previous two bars), showing no supply - no interest in lower prices. At Point C the market goes up in response to the low volume - so we know this is confirmation of the buying at Point A. At Point C we see further confirmation - a test in a rising market - the market has gone down, only to close on the high, it is a down-bar and the volume is low (less than the previous two bars) - a beautiful test, and you can see how the market responded. I took 25 points profit.

However, the chart below shows a lovely principle that is very powerful. First of all we see that during the day (when I was at the show) the market fell. But at Point A we see some very high volume - stopping volume - possible buying. This is followed by Point B where we have a down-bar but on low volume (volume less than the previous two bars), showing no supply - no interest in lower prices. At Point C the market goes up in response to the low volume - so we know this is confirmation of the buying at Point A. At Point C we see further confirmation - a test in a rising market - the market has gone down, only to close on the high, it is a down-bar and the volume is low (less than the previous two bars) - a beautiful test, and you can see how the market responded. I took 25 points profit.

Thursday 30 May 2013
X Marks the Spot
Nice simple one today. I went for 10 points, as I doubled my investment this time, and chose the no demand in the 5 minute chart, labelled X, below. It was perfect because I made my money in 4 seconds, so no stress or waiting. This is why it's important to me that I pick the right time to enter the market. If you look at the bar at Point A you will see it has a very wide spread, and the volume is very high (meaning supply). Also, it is approaching and fails to penetrate the resistance level above. The bar following it is a narrow spread bar with reasonable volume (not low), and that also fails to penetrate the resistance line above. The narrow spread and average volume means that the professional money are capping the market - selling into the buying. There is clearly reluctance to go above that level. The next three bars are down, confirming this, then at Point X we see what we are waiting for - no demand - up-bar, volume less than the previous two bars. There is little demand for higher prices, hence the next bar is down, which is where I took my profit.


Wednesday 22 May 2013
Easy Day
See the 5 minute chart of the Dow Jones below. Point A signifies a test in a rising market - classic down-bar, narrow spread, closing in the middle, volume less than the previous two bars. I went long at this point and, as the title to this blog suggests, it was not particularly stressful! The market responded nice and quickly to this test and I took 25 points profit. I exited the trade at this point for a few reasons - 1. 20 points is my target, 2. the bar was approaching a former level of resistance, 3. the half hour bar was about to finish, and the volume on that bar was extremely high (due to the News action at 3pm), which could have meant I would have watched my profit diminish which, as I write, is exactly what has happened - the half hour bar appears (at this moment) to be turning into a top reversal and a possible indication of weakness.


Monday 20 May 2013
Nice Test
The chart below is a 10 minute chart of the Dow Jones. Notice at Point A we see a classic test - a down-bar, closing near the high, and the volume is low (it is not less than the previous two bars, which is what we would ideally like to see, but the fact that it is quite low and the bar has dipped down only to close near the high is a good indicator of strength). Also, this test appears just after we've seen weakness on the previous bar. Point A is testing the supply on the previous bar. It has discovered there are no sellers, so it is a successful test and the market rises. I took my 20 points profit, thank you very much. Off for a bath and an evening out.


Tuesday 9 April 2013
Beautiful Set-up
Today we can see a beautiful set-up to go long, which I took, and made my 20 points profit. This is the perfect set-up for a long trade, and something we see time and time again. Below is a 30 minute chart of the Dow Jones. The set-up was also visible in the 10 and 20 minute timeframes. At Point A we see an ultra-high volume down-bar - possibility of buying, which is confirmed by the next bar being an up-bar. Then at Point B the market comes back down into the area of high volume at Point A, but the volume is low (less than the previous two bars), meaning that supply has dried up. The market has only one way to go - and that is up, which you can see!
I intend to stay in my trades longer when I see set-ups like this in the larger timeframes. It is a matter of confidence. I'll get there.

I intend to stay in my trades longer when I see set-ups like this in the larger timeframes. It is a matter of confidence. I'll get there.

Thursday 4 April 2013
17 Points Profit Today
What a beautiful day for some nice clear signals, although the market has been whipsawing. Below you will see a 30 minute chart of the Dow Jones and below that a 10 minute chart, but most timeframes were showing weakness at the time, which is ideal. We want all (or most) of the timeframes to be telling the same story.
On the 30 minute chart at Point A we see a top reversal - our first sign of weakness, but not something that would entice me to enter the market. We want to see confirmation of this weakness, and this we see at Point B - no demand. I went short at this point only to watch my profits increase at first, then to be at a loss! The market rises to Point C, but it rises on even less volume than at Point B. Plus we have a resistance level around that area. On a very low timeframe I watched a bar shoot through that resistance level at high speed. I'm sure that professional money know that many people trade at these levels and often go long when they see the price penetrate upwards, or short when they see it penetrate downwards, thus tricking them, and only to then drive the price the opposite way, which we then see on the bar after Point C.
On the 10 minute chart we see some lovely clear signals. At Point A we see our upthrust (lovely sign of weakness) and at Point B confirmation by way of a no demand.
I took 17 points profit.


Monday 1 April 2013
Tricky Monday
Today was what I call a 'typical Monday'. It's April fools' day, so that may have been some warning, but frequently on a Monday I see this type of action, and have often thought it's because professional money are testing the market. But that's just my reasoning and I could be wrong. Monday sometimes has a sideways movement, with conflicting signals, so it can be very tricky to trade, and I've often thought I'm going to keep away from the markets on Mondays because of this. Today I kept well out of it, although I was looking for trades, but my sister-in-law was here so I probably wasn't focusing properly either.
Below is a 10 minute chart of the Dow Jones. At Point A we see a giant shakeout (or so it looks). At this point I'm looking for confirmation that this sign of strength is going to work out, in either a test back down into the lower area of that bar - looking for a low volume down-bar closing middle or high to tell me supply has dried up. And you could say we see this at Point D, but the volume is a little too high, and at this point I'm feeling unsure. After the bullish shakeout at Point A we then get what looks like an upthrust at Point B, so a little reluctant to go long, then at Point C, in hindsight it's no demand, but we have all that strength in the background - high volume on a down-bar at Point A, so I did not act on Point C to go short. But, sod's law, it shoots down. It reacts to the 'shakeout' at Point D and goes up but hits no demand at Point E and more or less goes sideways after that.
So, to myself, a tricky day to trade and pleased I sat on my hands and kept out of it to face another day. I'm working away for two days this week so will be back Thursday to take a look (after my social engagements that day!)

Wednesday 27 March 2013
11 Points Profit Today
Today was a classic example of where fear can paralyse. However I did eventually go long in the market, having watched it go up a fair way already. I took 11 points, but happy with that. Below is a 10 minute chart of the Dow Jones. At Point A we see a shakeout - a lovely sign of strength. I would normally go long on a shakeout but this was at the market open so I was cautious - only to watch the market ascend. Point B is (in hindsight) no supply, but I'm never confident with these bars that have wide spreads down, closing on the low. I would have preferred a narrow bar, closing on the low, with low volume. At Point C I saw a test in a rising market, and a clear sign of strength. This was also visible in the 5 minute chart (which I have posted below the 10 minute chart) at Point A. I went long at this point and took 11 points profit as I saw the price approaching a resistance level (marked Point D on the 10 minute chart). At the time of writing the market has since gone sideways for a long time, and at this point (6pm) has just penetrated that resistance level. So for my own confidence (and time!) I was right to exit at this point.


Tuesday 26 March 2013
22 Points Profit Today
It was uncertain on the open of the market today. There were a few News items, and one half an hour after the market open, so I was cautious and kept away. Even after that it was not certain, but I was convinced there was weakness, with the high volume on up-bars created by the high volume of trades at the market open. Below you will see a 10 minute chart of the Dow Jones. Previous to Point A you will see high volume, but it's not excessive, hence my hesitation. However the market tends to go sideways after its initial move up, and does not make new highs. Point A marks an Upthrust, and a sign of weakness. On seeing this I went short (at its close), and followed the market down 22 points at which point I took my profit. It would have been great to stay in longer but I prefer to take my profit, especially as I wasn't too sure as to the market's intentions.


Thursday 21 March 2013
Back to it gently
Finally ........ back to trading, after quite a long break, although I haven't been far away, and have been following what has been happening in the markets, but have been very busy with other commitments that have required time and focus. Trading in itself takes time and focus and if you haven't got that time then don't do it. It's really easy to lose money if you are not concentrating.
Today I took 12 points profit but happy with that as I'm just getting back into it. There is a 5 minute chart of the Dow Jones below. Upon the market open the price fell and, on the larger (1 and 2 hour) timeframes it was clear some buying had come in, ie. high volume on down-bars. The market responded upwards. Upon seeing the turn around I was looking out for some confirmation, ie. a test or no supply, to enter. This I found on the 5 minute chart at Point A. I stayed with it until Point B at which point I exited the trade. My reason for this was that to the left there was a possible area of resistance, and with it being my first trade I wanted to get out with a profit in order to be in the right frame of mind for tomorrow and beyond. Of course, the market later continued up. BUT ..... we do not kick ourselves upon discovering this - we are happy with our profit. We know that with time and continued consistent success we will have confidence to stay in and take greater profits. It is CONSISTENCY that is the winning word in trading. All the losers win, lose, win, lose, win, lose. The winners WIN, but CONSISTENTLY.

Today I took 12 points profit but happy with that as I'm just getting back into it. There is a 5 minute chart of the Dow Jones below. Upon the market open the price fell and, on the larger (1 and 2 hour) timeframes it was clear some buying had come in, ie. high volume on down-bars. The market responded upwards. Upon seeing the turn around I was looking out for some confirmation, ie. a test or no supply, to enter. This I found on the 5 minute chart at Point A. I stayed with it until Point B at which point I exited the trade. My reason for this was that to the left there was a possible area of resistance, and with it being my first trade I wanted to get out with a profit in order to be in the right frame of mind for tomorrow and beyond. Of course, the market later continued up. BUT ..... we do not kick ourselves upon discovering this - we are happy with our profit. We know that with time and continued consistent success we will have confidence to stay in and take greater profits. It is CONSISTENCY that is the winning word in trading. All the losers win, lose, win, lose, win, lose. The winners WIN, but CONSISTENTLY.
Tuesday 22 January 2013
Nice One
Take a look at the one hour chart of the Dow Jones below. At Point A (previously in the day) we see a test/shakeout - a bullish sign. Also at Point B we see what looks like a test. This bar finished at 1pm (UK time). As mentioned before, I avoid being in the market at or before the Open, so watched what the market did on the Open, and then at Point C I see my opportunity - this is a test bar - down-bar, volume less than the previous two bars, and it closes near the high. This means the market dipped down to the low of that bar and did not find any sellers, only to close near the high. Now I want to find confirmation of this strength, so I look down to the 10 minute or 15 minute charts. On this occasion the 10 minute chart gives me confirmation (see the next chart down), and at Point A I see a test. It is a black bar, volume less than previous two bars, and a narrow spread. At this point I enter the market long and exit at Point B where a sign of weakness arrives (a narrow spread, increase in volume, and Tradeguider has also picked this out as a sign of weakness). The narrow spread coupled with increase in volume shows that the price has been capped and there is little interest to the upside. I took my profit but, in hindsight, of course, I could have taken more. BUT we don't have a crystal ball, and this is real money we are dealing with, so it's best to err on the cautious side (in my opinion). It is with increasing confidence that we can stay in the market longer, and this is something we develop over time, using caution, practice, and minimising losses. It is losses that erode confidence. Always maintain good psychology so that you are strong for the next day.


Wednesday 16 January 2013
Back Into It
Many apologies for being 'absent' for quite a while. Since Christmas I have had many other commitments that have not only required my time but also my attention. Trading is a game of concentration and if we are not totally absorbed in it and we cannot give all our time and attention to it then it is best to STAY AWAY. A poor psychological state will lose us money. We want to protect our trading account.
Today, before the market open, I saw a nice sign of strength. See the chart below which is a 30 minute chart of the Dow Jones. At Point A we see an increase in volume. OK, this volume is not ultra-high, but nevertheless it is an increase compared to the bars before it. The next bar is up, which means that there was some buying at Point A, but the bar which is what we are looking for is Point B - a test - low volume compared to that at Point A. Now the market opened, and then we need to see confirmation, which we see in the 15 minute chart (see further below). This is a test, even though it is a black bar (meaning it closed level with the previous bar). It has a narrow spread, and very low volume. At this point I scrolled down to lower timeframes to check we had strength there also in order to get an optimum entry point, then went long. I followed the bars, checking lower timeframes, where there was evidence of testing along the way. This is why VSA is so good - you can check and manage your trade by looking out for signs that it is going to continue in your direction. I exited the market close to the resistance level above, taking my 20 pips profit. Happy with that.


Monday 7 January 2013
An Experiment
Today, as I have an appointment later and need to go out, I tried something a little different. At the market open I watched the one minute chart (see below) and traded a principle, purely on this timeframe, to take advantage of the market volatility. It was a successful experiment. Take a look at the one minute chart of the Dow Jones below.
At Point A, a few minutes after the market open, we have seen a down-move. At Point A we have an up-bar on low volume (volume less than the previous two bars). That means there is little interest in the up-side from the professionals. I entered the market at Point A, short. At Point B, the market has, over two bars, tried to go up, but on low volume. This was confirmed on the two minute chart as one bar on low volume, so I knew to stay in the trade. The market then falls nicely to Point C, but the volume as you can see is very high on this bar, and the next bar is up. This is possible buying and a sign of strength, and this is confirmed at Point D - a low volume bar which comes back down into the area of Point C (with the very high volume). This is a classic sign of strength. When the market goes back down into an area which previously had high volume (Point C) but on low volume, this means the supply has dried up - there is no interest in the down-side, and the market is likely to go up. I exited my trade at Point D and took 10 points profit. It's important to exit a trade when you see an opposite sign, ie. a sign of strength when you are short, rather than to wait and hope it will be OK. This is not always the case. The market is unrelenting and will chop you up into little bits at every opportunity.
This was an experiment, and not something I would recommend, and the utmost caution was required. However, it does show two principles clearly - one of strength and one of weakness.

Subscribe to:
Posts (Atom)