
Wednesday, 19 June 2013
Lost Today
Today I lost 11 points. The chart below is a 10 minute chart of the Dow Jones. At Point A we see what looks like a test - down-bar, low volume, closing near the high. The test failed, as you will see by the down-bar following, and as I saw weakness in the lower timeframes I got out at a loss. In hindsight you can see that at Point A we've reached an area of possible resistance - a previous level. This is probably why the test failed. Plus, following the failed test the market has literally gone sideways - a warning that this is not a good day to trade, not so far anyway.


Friday, 14 June 2013
12 Points Profit
I was short for time today, which usually means I don't trade, but I took a quick trade and made 12 points profit. There was News at 2.55pm and the market rose rapidly. I watched this happening until eventually some weakness appeared in several of the timeframes. The chart below is the 10 minute, but weakness also appeared on the 15 and 20 minute charts. The signal on this chart, at Point A, says supply coming in. The reason for this is because we have had an up-move and eventually, at Point A, the volume has increased and it has closed off the high. However, this is not enough evidence for us to go short (sell). We need to see confirmation that there is weakness. Of course, yes, as is the case, the market falls quite a bit, and I am watching it, but I do not get in. I wait for confirmation which I see on the 5 minute chart. See the chart below this one.
On the 5 minute chart at Point A we have no demand (no interest in higher prices). This alone is not enough for us to enter the market, but coupled with the weakness that has also appeared at this point on the larger timeframes, it alerts us to a possible trade. The market then falls (confirming the no demand), then at Point B we have another no demand - confirmation. This is my point to go short. I took my profit thank you very much.
I have had a very good week again and my aim next is to stay in my trades longer and really rocket the profits. However, caution is required. I have found what works, I'm building my account steadily, so there's a little voice in my head telling me "if you've found something that works, why change it?" So I'm considering carrying on as I am and investing more in each trade for higher gains. Will meditate on it!


On the 5 minute chart at Point A we have no demand (no interest in higher prices). This alone is not enough for us to enter the market, but coupled with the weakness that has also appeared at this point on the larger timeframes, it alerts us to a possible trade. The market then falls (confirming the no demand), then at Point B we have another no demand - confirmation. This is my point to go short. I took my profit thank you very much.
I have had a very good week again and my aim next is to stay in my trades longer and really rocket the profits. However, caution is required. I have found what works, I'm building my account steadily, so there's a little voice in my head telling me "if you've found something that works, why change it?" So I'm considering carrying on as I am and investing more in each trade for higher gains. Will meditate on it!


Wednesday, 12 June 2013
Upthrust + Why To Be Cautious of Market Open
I took 20 points today, short, on the 5 minute chart of the Dow Jones. See the chart below. At Point A is our upthrust. Not only is it an upthrust, it has very high volume (selling), and we have the added bonus of it penetrating an area of resistance, but closing on the low, below that level.

Also see the 1 hour chart below. This is a good illustration of why we must be very cautious at the market open, and why I would not want to be in a trade before the market open. The bar at Point X, you would think, is a test. The programme has put up a signal saying this. However, beware the volume is not less than the previous two bars, so this means there is some supply in here. But to the eye, the bar looks like a test. You may think this will influence the market, but the next bar, which is at market open, is a trap upmove (serious sign of weakness), and the market has fallen since. So beware trading at the market open. Because of the volatility it can be very profitable, but it is also very dangerous. There are traders who do trade at the open, and make good money, so I'm sure it's possible. But my aim is to avoid too much stress! If trading becomes very stressful we build a negative association, which is detrimental to our success.
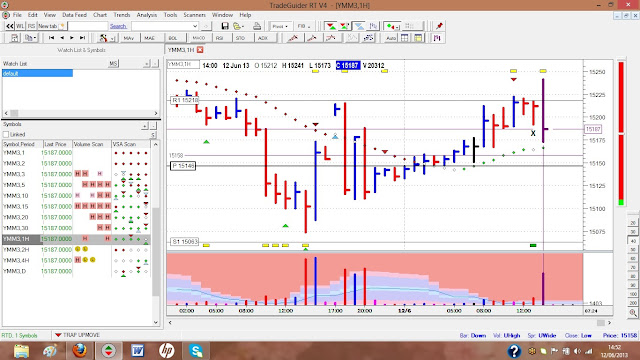

Also see the 1 hour chart below. This is a good illustration of why we must be very cautious at the market open, and why I would not want to be in a trade before the market open. The bar at Point X, you would think, is a test. The programme has put up a signal saying this. However, beware the volume is not less than the previous two bars, so this means there is some supply in here. But to the eye, the bar looks like a test. You may think this will influence the market, but the next bar, which is at market open, is a trap upmove (serious sign of weakness), and the market has fallen since. So beware trading at the market open. Because of the volatility it can be very profitable, but it is also very dangerous. There are traders who do trade at the open, and make good money, so I'm sure it's possible. But my aim is to avoid too much stress! If trading becomes very stressful we build a negative association, which is detrimental to our success.

Thursday, 6 June 2013
Great Opportunity
I wasn't going to trade today. I was out all day in the sunshine selling wool-filled British duvets with a friend at a big agricultural show! But when I got home I put my laptop on and saw a lovely test in the 20 minute chart. I was very cautious about going long (buying) because the market has recently been extremely weak and there was nothing in the daily chart to say that it would be any different today.
However, the chart below shows a lovely principle that is very powerful. First of all we see that during the day (when I was at the show) the market fell. But at Point A we see some very high volume - stopping volume - possible buying. This is followed by Point B where we have a down-bar but on low volume (volume less than the previous two bars), showing no supply - no interest in lower prices. At Point C the market goes up in response to the low volume - so we know this is confirmation of the buying at Point A. At Point C we see further confirmation - a test in a rising market - the market has gone down, only to close on the high, it is a down-bar and the volume is low (less than the previous two bars) - a beautiful test, and you can see how the market responded. I took 25 points profit.

However, the chart below shows a lovely principle that is very powerful. First of all we see that during the day (when I was at the show) the market fell. But at Point A we see some very high volume - stopping volume - possible buying. This is followed by Point B where we have a down-bar but on low volume (volume less than the previous two bars), showing no supply - no interest in lower prices. At Point C the market goes up in response to the low volume - so we know this is confirmation of the buying at Point A. At Point C we see further confirmation - a test in a rising market - the market has gone down, only to close on the high, it is a down-bar and the volume is low (less than the previous two bars) - a beautiful test, and you can see how the market responded. I took 25 points profit.

Thursday, 30 May 2013
X Marks the Spot
Nice simple one today. I went for 10 points, as I doubled my investment this time, and chose the no demand in the 5 minute chart, labelled X, below. It was perfect because I made my money in 4 seconds, so no stress or waiting. This is why it's important to me that I pick the right time to enter the market. If you look at the bar at Point A you will see it has a very wide spread, and the volume is very high (meaning supply). Also, it is approaching and fails to penetrate the resistance level above. The bar following it is a narrow spread bar with reasonable volume (not low), and that also fails to penetrate the resistance line above. The narrow spread and average volume means that the professional money are capping the market - selling into the buying. There is clearly reluctance to go above that level. The next three bars are down, confirming this, then at Point X we see what we are waiting for - no demand - up-bar, volume less than the previous two bars. There is little demand for higher prices, hence the next bar is down, which is where I took my profit.


Wednesday, 22 May 2013
Easy Day
See the 5 minute chart of the Dow Jones below. Point A signifies a test in a rising market - classic down-bar, narrow spread, closing in the middle, volume less than the previous two bars. I went long at this point and, as the title to this blog suggests, it was not particularly stressful! The market responded nice and quickly to this test and I took 25 points profit. I exited the trade at this point for a few reasons - 1. 20 points is my target, 2. the bar was approaching a former level of resistance, 3. the half hour bar was about to finish, and the volume on that bar was extremely high (due to the News action at 3pm), which could have meant I would have watched my profit diminish which, as I write, is exactly what has happened - the half hour bar appears (at this moment) to be turning into a top reversal and a possible indication of weakness.


Monday, 20 May 2013
Nice Test
The chart below is a 10 minute chart of the Dow Jones. Notice at Point A we see a classic test - a down-bar, closing near the high, and the volume is low (it is not less than the previous two bars, which is what we would ideally like to see, but the fact that it is quite low and the bar has dipped down only to close near the high is a good indicator of strength). Also, this test appears just after we've seen weakness on the previous bar. Point A is testing the supply on the previous bar. It has discovered there are no sellers, so it is a successful test and the market rises. I took my 20 points profit, thank you very much. Off for a bath and an evening out.


Subscribe to:
Posts (Atom)